Mastering market movements is at the heart of swing trading, where the focus isn’t just on quick profits but on crafting a strategy for sustained financial success.
Market engagement isn’t for the timid; it’s for the sharp-eyed, strategic, and agile.
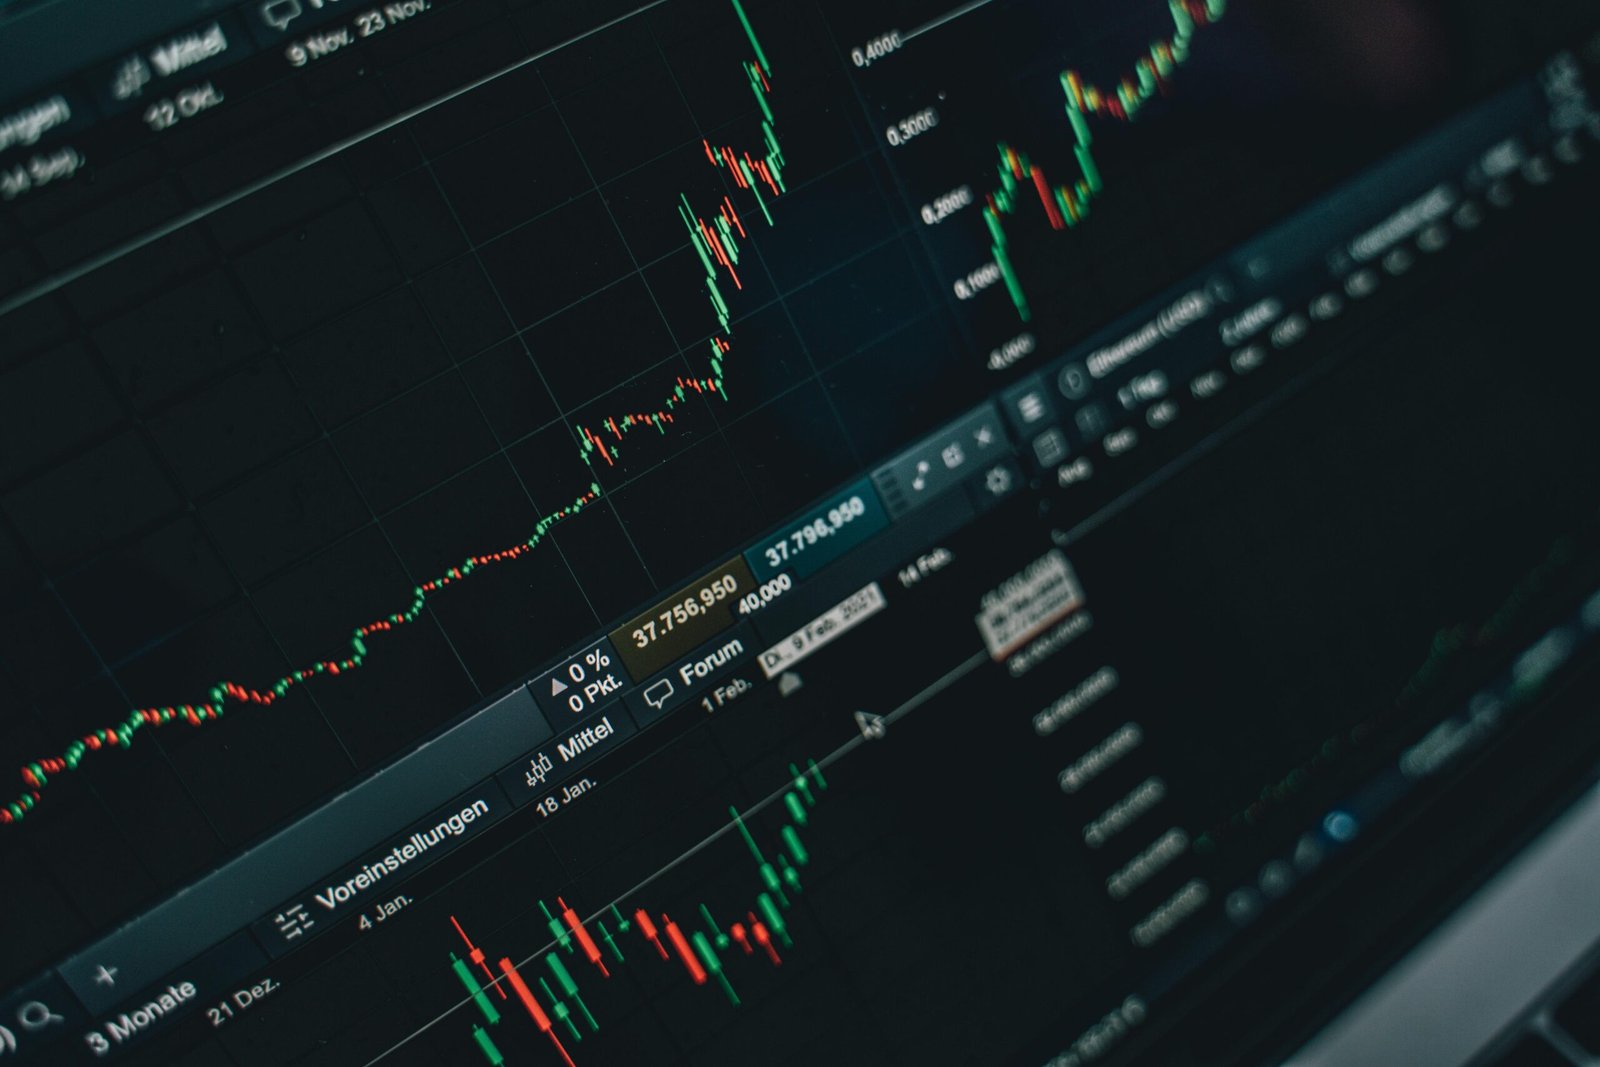
Use real-time data and analytics to gain the edge in swing trading. Learn to use MACD, select stocks like Tesla or trade currencies and then manage risks for lasting gains.
Why Swing to the Beat of Swing Trading?
The unpredictable nature of sectors like technology makes them a playground for swing trading. The reactions to earnings reports or new product releases can create fertile ground for lucrative opportunities. For example, a company like Apple might unveil results that are much better or worse than expected, sparking a swift and profitable reaction in the market.
Decoding Market Swings
Staying ahead of the curve with real-time event monitoring, like geopolitical developments or economic updates, can dramatically influence stock prices. These moments offer prime buying or selling opportunities for the astute swing trader, especially when equipped with tools that provide instant alerts and updates.
Technical Analysis: The Swing Trader’s Excalibur
Indicators such as Moving Average Convergence/Divergence (MACD) are invaluable to the swing trader. When Apple’s MACD line eclipses its signal line, it’s a solid indicator that it might be time to buy, offering a potentially optimal entry point.
Choosing the Right Stocks
Companies like Tesla, known for their high liquidity and volatility, stand out as prime candidates for swing trading. Access to real-time data platforms can offer insights into trading volumes and price movements crucial for picking winning stocks.
Risk Management: Swinging with a Safety Net
The volatile nature of the market demands rigorous risk management tactics. Setting a stop-loss order for a 5% drop on unpredictable stocks like Nvidia can safeguard against unexpected downturns, protecting your investment from severe losses.
Keeping Up with Market Trends: Mastering Market Movements
The recent shift toward renewable energy by governments worldwide has injected a new level of volatility into relevant sectors, including companies like Tesla and First Solar. These developments can create a host of swing trading opportunities if one can analyze and act on these trends in real-time.
Technological Tools for Swing Traders
Platforms such as TradingView and MetaTrader equip traders with the ability to set up automated alerts, implement customizable indicators, and dissect data on the fly. These tools not only make trading more efficient but dramatically enhance the trader’s ability to make informed decisions.
Advanced Techniques in Swing Trading
This golden knowledge, born from market volatility, acts as your guide through financial storms. Secrets of Fibonacci, Elliott, and candlesticks blend to navigate market waters. With these strategies, traders seek mastery, not just profit. Each trade shapes your financial saga. Let swing trading lead you to sustainable success.
Fibonacci Retracements: Mastering Market Movements
Fibonacci retracements use horizontal lines to indicate areas of support or resistance at the key Fibonacci levels before the price continues in the original direction. These levels are derived from the Fibonacci sequence and often include 23.6%, 38.2%, 50%, 61.8%, and 100%. Traders use these levels to predict potential reversals in the market.
Elliott Wave Theory
This theory proposes that stock prices move in predictable, repeating waves based on investor psychology. It consists of impulse waves (that move with the trend) and corrective waves (that move against the tapering trend). Identifying these waves can help traders anticipate market moves and position themselves for both short and long-term gains.
Advanced Candlestick Patterns
Beyond basic candlestick patterns like the doji or hammer, advanced patterns such as the engulfing patterns, the harami, and the evening star, provide deeper insights into market sentiment and potential reversals. Mastery of these patterns helps traders pinpoint precise entry and exit points.
Relative Strength Index (RSI) Divergences
The RSI is a momentum oscillator used to measure the speed and change of price movements. Divergences occur when the RSI direction differs from the price direction, signaling potential bullish or bearish reversals. For instance, if the price of a stock makes a new low but the RSI starts to climb, a bullish divergence is indicated.
Moving Average Convergence Divergence (MACD)
This trend-following momentum indicator shows the relationship between two moving averages of a security’s price. The MACD is calculated by subtracting the 26-period Exponential Moving Average (EMA) from the 12-period EMA, helping traders identify potential reversals based on bullish or bearish momentum signals.
Volume Analysis
Volume analysis involves examining the number of shares or contracts traded in a security or market during a given period. It’s crucial for confirming trends. A price move with relatively high volume is seen as stronger and more likely to persist than a move with weak volume.
Volatility Index (VIX) Usage
Often referred to as the “fear index,” the VIX measures the market’s expectation of volatility based on S&P 500 index options. Traders use the VIX to understand market sentiment and potential increases in volatility, which are often associated with market declines.

Case Study: Successful Amazon Swing Trade
Consider the aftermath of Amazon’s latest earnings announcement: the stock took a dive despite surpassing expectations, presenting an ideal ‘swing low’ buying scenario. Using RSI and MACD indicators, traders could identify this dip as temporary, positioning themselves perfectly to capitalize on the ensuing rebound.
In essence, mastering swing trading involves a blend of strategic foresight, technical skill, and an unerring sense of timing. It’s about deciphering market rhythms and striking with precision, all while managing the inherent risks that come with volatile investments.
Markets tested us, yet we’ve mastered swing trading’s art, becoming gladiators. We’ve wielded technical analysis with skill.
Now, with market wisdom, seize opportunities like a falcon. This chapter in your trading story will echo through time.
For Investopedia’s take on an introduction to swing trading and mastering market movements – see here.
Check out 8 Market Flow Strategies here
Disclaimer: The information provided here is for educational purposes only. It does not constitute investment advice or a guarantee of performance. Investing involves risks, including the possible loss of capital. Seek advice from financial and tax professionals tailored to your financial circumstances and goals.